An AI-powered marketing dashboard in 2026 does three things a stack of single-platform reports cannot: it stitches data from Google Ads, GA4, GSC, HubSpot, Meta Ads, LinkedIn Ads, and call tracking into one end-to-end view; it flags channel anomalies and conversion drops in real time; and it forecasts the next 30 to 90 days of MQL and pipeline against spend. Most marketing teams are still toggling between five to ten tabs every Monday morning, reconciling numbers that never quite match. The shift is from per-tool reporting to a unified, AI-assisted analytics layer that answers the only question that matters: which dollar drove which deal.
This post walks through what the typical marketing reporting stack already does well, the integration problem that defeats it, the three functions AI specifically earns its place for, the six modules a 2026 marketing dashboard should surface, and the build-versus-buy call between Looker Studio and a proper data warehouse plus BI layer.
What the typical marketing reporting stack already does well
Most B2B marketing teams already have the descriptive reporting layer covered. The standard 2026 stack usually includes:
- Google Ads and Meta/LinkedIn Ads native reporting. Spend, impressions, clicks, CTR, CPC, and platform-attributed conversions by campaign and audience.
- GA4 + Google Search Console + Tag Manager. Site sessions, channel attribution under the default channel group, key-event volume, and search query / impression / click data on organic.
- HubSpot, Marketo, or another marketing automation platform. Form submissions, MQL-to-SQL movement, email open and click rates, workflow performance.
- CallRail, CallTrackingMetrics, Invoca, or DialogTech. Inbound call sources, dynamic number insertion, and call-to-lead attribution from offline conversion paths.
- BI surface (Looker Studio, Power BI, Domo, or Tableau). Aggregated cross-tool dashboards usually wired up by a contractor at some point in the last two years.
Each tool reports well within its own walls. Google Ads will tell you exactly which keyword group converted at what cost-per-conversion inside Google Ads. HubSpot will tell you exactly which forms drove MQLs inside HubSpot. The problem starts the moment you try to answer a question that crosses the wall: which paid keyword eventually closed as revenue. Which organic landing page assisted the most pipeline. Whether the LinkedIn Ads campaign that looks expensive at $80 CPL actually generated higher-LTV accounts than the cheaper Meta campaign. Single-platform reporting cannot answer those questions, and most marketing teams in 2026 are still piecing the answer together by hand in a spreadsheet on Monday morning.
The integration problem: why end-to-end marketing analytics is hard
The integration problem has three layers, and most attempts to fix it pick one layer and ignore the other two.
Layer one is identity. A single buyer touches the site as an anonymous GA4 client_id, fills a HubSpot form as a real email, calls a CallRail tracking number from a different device, then closes as a CRM record three weeks later. Stitching those four touchpoints to one person is the hard part of attribution. Tools like HubSpot tracking plus a server-side GTM container plus CallRail's native HubSpot integration get most of the way there, but the gaps still need to be reconciled with reverse-ETL logic or a CDP. Without the stitch, every downstream metric is wrong.
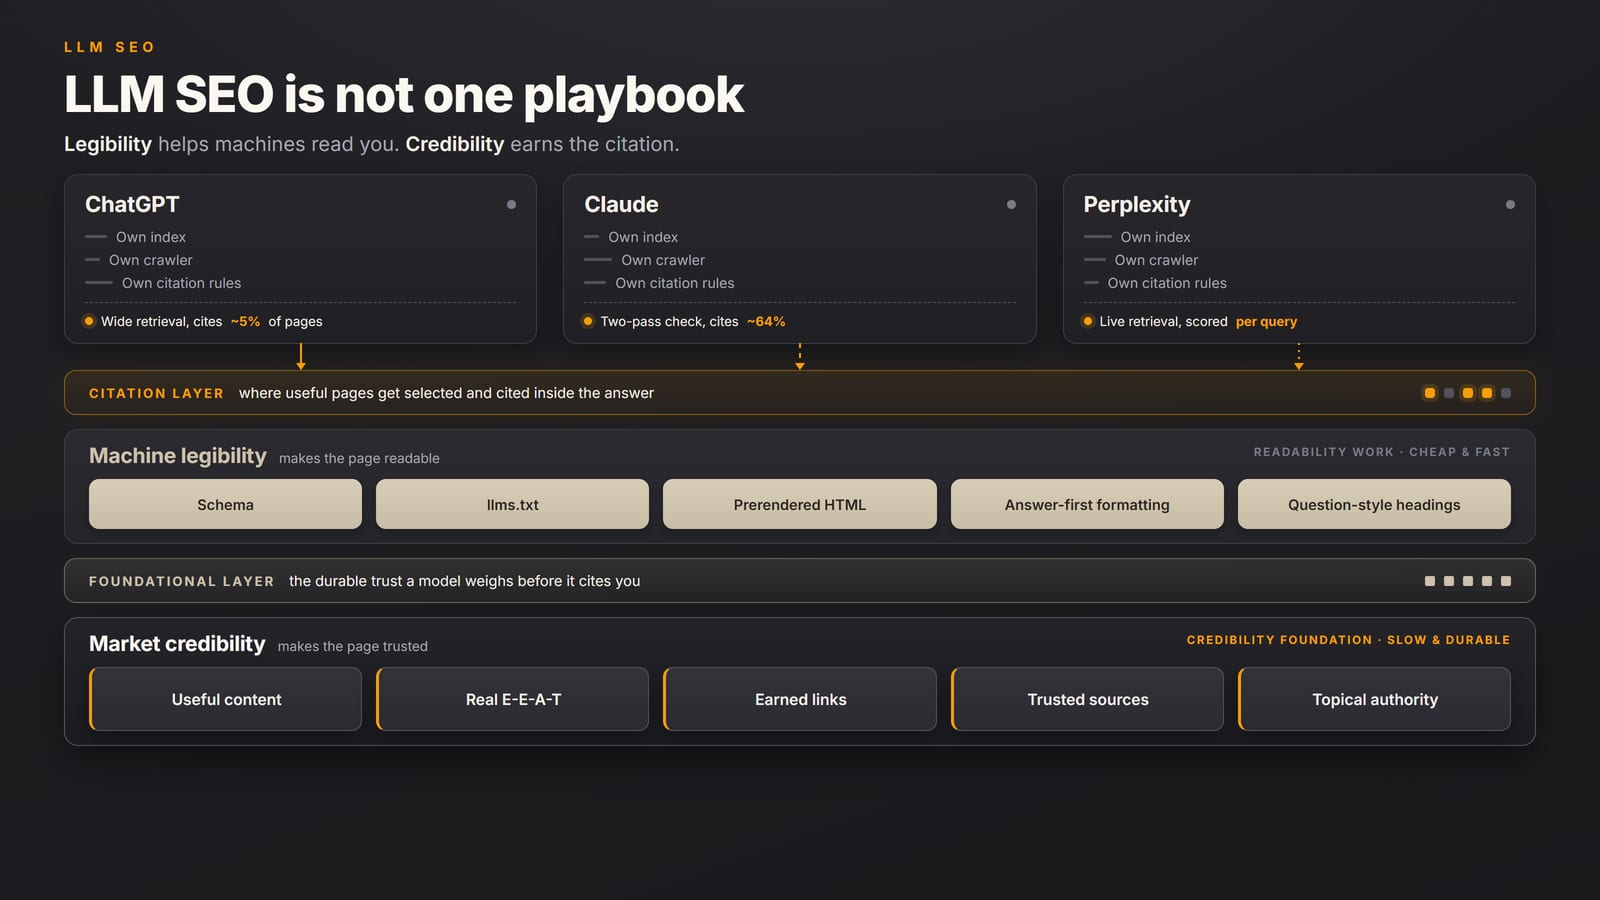
Layer two is UTM and source discipline. Default GA4 channel rules will classify HubSpot transactional emails as "Email" if HubSpot rewrites links with utm_medium=email. They will classify some LinkedIn organic shares as "Direct" because LinkedIn strips referrers. Paid Meta campaigns can show up under "Social" if UTMs are missing. None of this is GA4's fault; it is doing what its rules say. But every misclassification compounds when the BI layer aggregates across channels. Building a custom channel group in GA4 with Transactional, Paid Social, Organic Social, Branded Search, and Non-Branded Search buckets, all positioned above the default fallback, is one of the higher-ROI hours a B2B marketing team can spend.
Layer three is definition alignment. Marketing's "lead" is anyone who fills a form. Sales's "lead" is anyone the BDR has accepted. Finance's "lead" is anyone with a closed-won deal. The reporting layer cannot reconcile these definitions unless they are encoded into the data model: a lead-status field that maps explicitly to a marketing stage, a sales stage, and a revenue outcome. Forecastio's benchmarking found that improving CRM data hygiene can lift forecast accuracy by up to 30 percent, more than most model upgrades. The same gain applies to attribution: when "lead" means the same thing across HubSpot, Salesforce, and GA4, blended ROAS becomes a number you can actually trust.
The integration problem is also a data freshness problem. B2B contact data decays at roughly 2.1 percent per month per Marketing Sherpa research published on HubSpot's Database Decay Simulation, which means 22 percent of last year's database is already wrong this year. Any AI layer that runs on stale data will hallucinate confidently. Solving the integration problem is gating; everything else compounds from there.
What AI specifically adds to a marketing dashboard
Once the integration layer is in place, AI earns its position by performing three jobs the descriptive reporting layer cannot.
First, real-time anomaly flagging across channels. Conversion rate on the demo-request page just dropped from 4.2 percent to 1.8 percent over the last 48 hours. Cost-per-lead on the LinkedIn Ads campaign just doubled. Branded search impressions just spiked 40 percent. The default reports will surface those changes in next week's deck. The AI layer flags them today and ties the flag to a likely cause (a landing-page A/B test, a creative rotation, a competitor launch). This is where modern marketing intelligence vendors and revenue-intelligence platforms have been investing the most heavily in 2026.
Second, multi-touch attribution and pipeline-level forecasting. Single-touch attribution (first touch or last touch) was always wrong for B2B because buying journeys span 8 to 30 touches. Multi-touch and AI-assisted attribution models (Markov chains, Shapley values, time-decay weighting) reweight channel contribution to match the actual buyer path. Optifai's 2025 benchmark of 939 companies found AI-assisted forecasting variance lands at ±8 to 15 percent vs ±25 to 35 percent on rep roll-up methods. The same kind of model applied to marketing pipeline forecasting (MQL volume by source, expected SQL conversion, expected closed-won) tightens the next-quarter forecast in the same way. The honest framing: AI is good at "what will next 30 days of MQL look like," not "which specific lead will close on Tuesday."
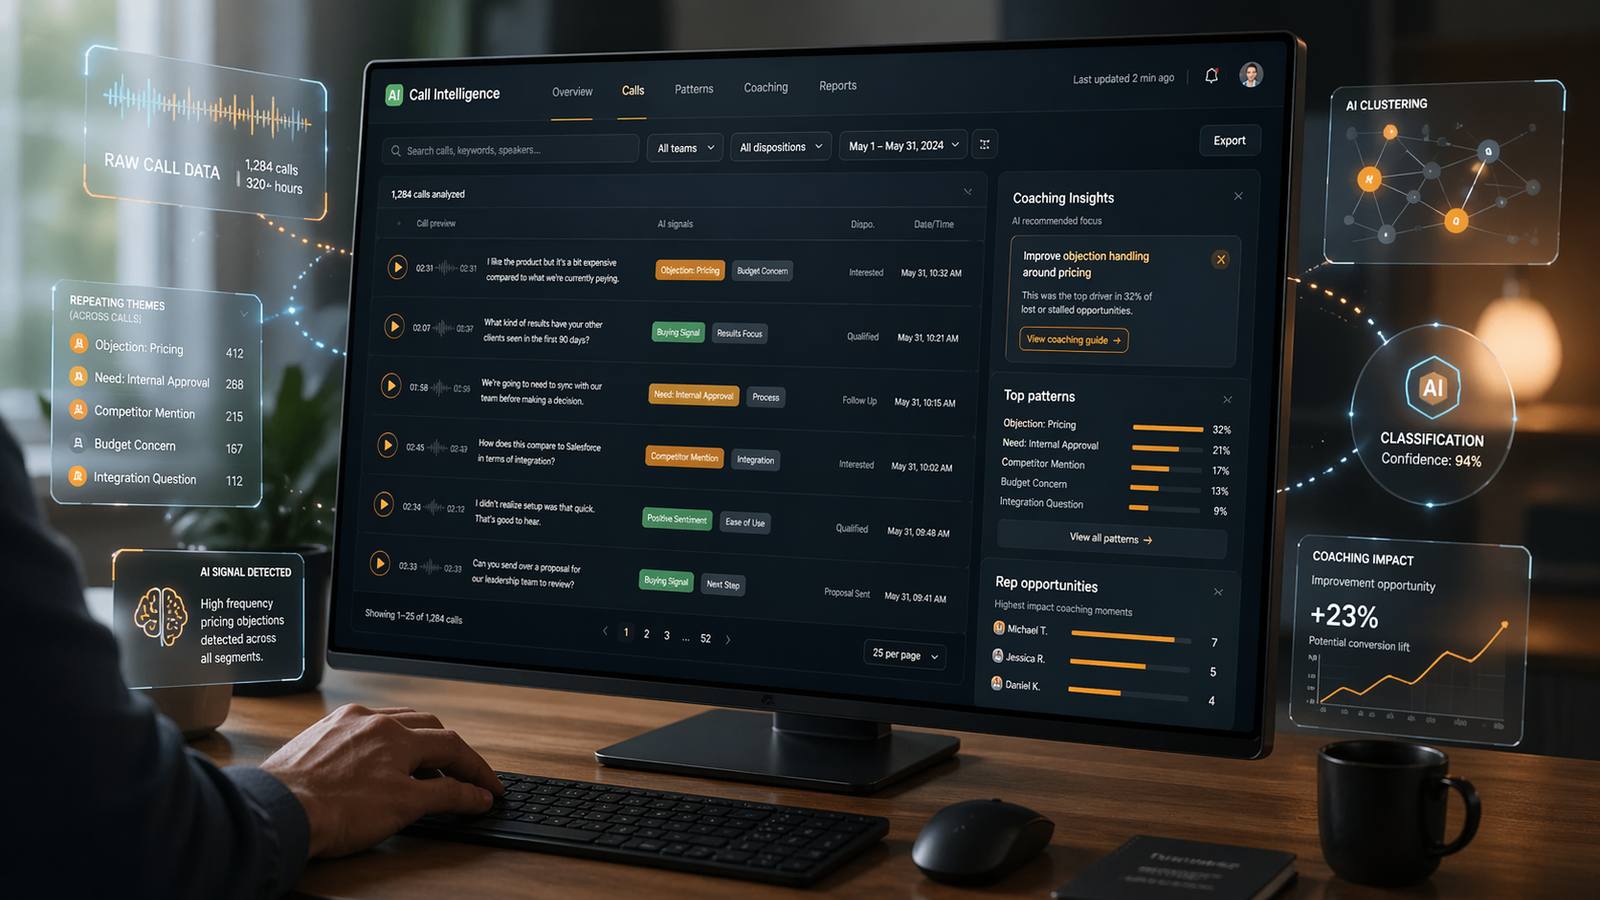
Third, signal extraction from unstructured marketing data. Form submission notes. Live-chat transcripts. Inbound call recordings from CallRail or CallTrackingMetrics. Email replies. Comments on LinkedIn ads. Each of those data streams is text the BI tools cannot natively parse. AI summarizes them, classifies intent, extracts objection patterns, and surfaces themes that map to landing-page or ad-copy decisions. A marketing team that has been blind to call content can suddenly see the top three reasons buyers were calling but not converting, with the volume per reason, week over week.
AI does NOT do is replace the marketer's judgment on creative, channel mix, or message-market fit. It surfaces signal faster. The decision still belongs to the human.
The six modules of a 2026 marketing dashboard
A useful 2026 marketing dashboard surfaces six modules. The order matters because each subsequent module depends on the data quality and integration work done in the earlier ones.
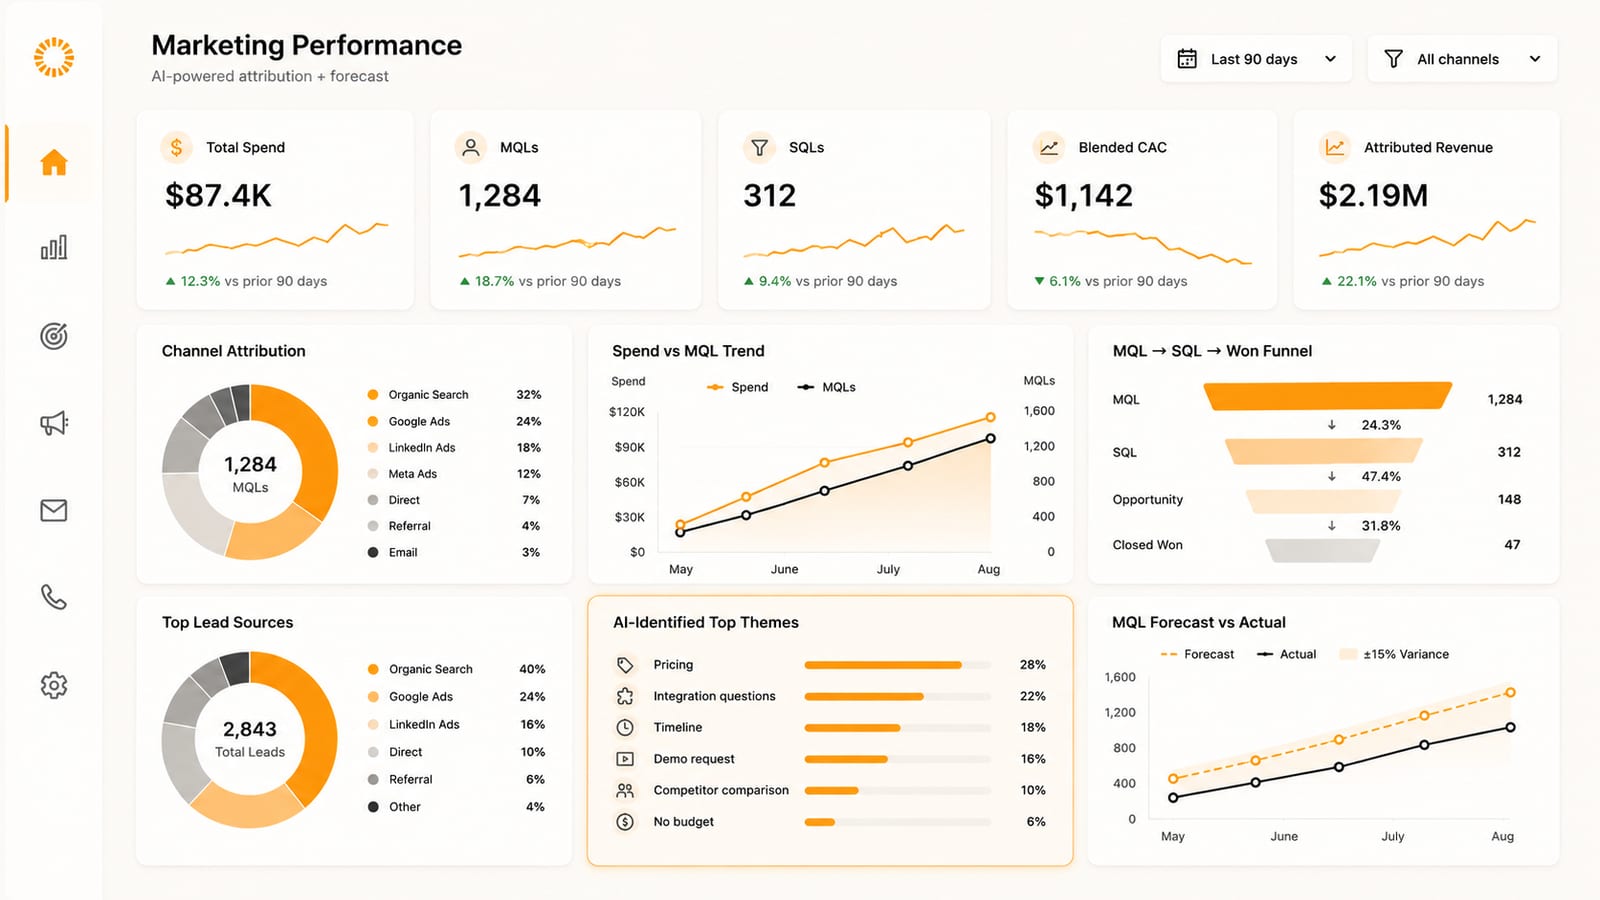
- Module 1: multi-source channel attribution. Blended view of paid (Google Ads, Meta Ads, LinkedIn Ads), organic (GA4 + GSC + branded search separated from non-branded), referral, direct, email, and call sources, all rolled up under a custom channel group that handles HubSpot transactional traffic, paid-social misclassification, and partner referrals correctly. This is the foundation.
- Module 2: MQL → SQL → closed-won funnel by source. Conversion rate at each stage by lead source and campaign, with the actual definitions of MQL, SQL, and closed-won held constant across marketing, sales, and finance reporting. This is the module that surfaces which channel ROI is real and which is vanity.
- Module 3: call source and attribution. Inbound calls from CallRail or CallTrackingMetrics with dynamic number insertion, mapped to ad campaign, organic keyword, or landing page. AI-extracted call disposition (qualified, not qualified, needs follow-up) auto-pushed into HubSpot. This is where most B2B marketing teams have the largest blind spot.
- Module 4: creative and copy performance with AI insights. Ad creative and landing page variants tracked with conversion rate by audience, plus AI-summarized themes from comments, form notes, and call transcripts that explain WHY a creative worked. The dashboard shows performance plus the qualitative signal underneath it.
- Module 5: blended ROAS / cost-per-account. Not cost-per-lead in isolation. Total marketing spend per net-new closed-won account, sliced by source and segment. The number that actually goes to the CFO. Anything cheaper to measure tends to mislead.
- Module 6: forecast and anomaly alerts. Next-30-day MQL forecast by channel with the AI variance band attached. Real-time anomaly alerts that fire when conversion, CPC, or spend deviates more than a configurable threshold against trend. Routed to Slack or email with a one-line diagnosis.
Vanity metrics to remove, and what to replace them with
Five marketing metrics show up on almost every dashboard and earn their place on roughly none. They describe activity without guiding action.
- Impressions to attention-weighted impressions or viewable-and-engaged. Raw impression counts measure ad budget more than ad effectiveness. Where the ad platforms expose viewability and attention metrics, use those.
- Click-through rate in isolation to CTR × downstream conversion. A 4 percent CTR campaign that drives no MQLs is worse than a 1.5 percent CTR campaign that drives qualified pipeline. Always pair CTR with what happened next.
- Cost-per-lead to cost-per-qualified-account. CPL across LinkedIn, Meta, and Google looks comparable on the surface and is misleading underneath. Cost per account that reached SQL is the number that survives the CFO.
- Total session count to engaged session count by intent. GA4's engaged sessions field is closer to honest. Add an intent filter (commercial-intent landing pages versus blog or branded pages) and the picture tightens further.
- Aggregate channel ROAS to ROAS by audience segment. Aggregate hides two or three audience-segment combinations that are dragging blended performance down. The segment-level cut tells the marketer exactly which audience to pause or rebuild.
A useful exercise: pick three of the five legacy metrics, remove them from the next monthly report, and see if anyone asks where they went. If the answer is no, they were vanity. If the answer is yes, they were load-bearing for a specific stakeholder and the replacement needs to ship before the swap.
When to build in Looker Studio, when to invest in a data warehouse and BI layer
The build-versus-buy question follows a simple decision tree. Free or near-free options (Looker Studio with Supermetrics or Funnel.io connectors) are enough when three things are true: the data sources fit inside Google's native connectors plus one or two paid connectors, freshness up to 24 hours is acceptable, and the team can live with the limited transformation logic Looker Studio supports.
A proper data warehouse (BigQuery, Snowflake, or Postgres) plus a BI surface (Looker, Metabase, Hex, or Mode) earns its keep when at least one of these is true: data spans more than five sources and they need cross-source joins, freshness below an hour matters because the team is making daily budget decisions, the org needs row-level security (different stakeholders see different segments), or the AI layer needs to run on the warehouse rather than on the BI surface.
The middle band is where most growth-stage B2B teams sit. The pragmatic Synapse Edge default in that range is to keep the daily operational reporting in Looker Studio (cheap, fast to iterate) and build a thin warehouse layer (BigQuery + Metabase) for the cross-source modules: blended attribution, multi-touch path analysis, AI-extracted call themes, and forecast modeling. The expensive full Looker / Tableau implementation can wait for the next growth step.
Key takeaways
- Single-platform marketing reporting (Google Ads, GA4, HubSpot, Meta, LinkedIn, CallRail) is necessary but never sufficient. The dashboard that matters answers the cross-tool question: which dollar drove which closed-won account.
- Solve the integration problem first: identity stitching, UTM and source discipline (custom GA4 channel group), and lead-definition alignment across marketing, sales, and finance. AI on top of dirty integration data will hallucinate.
- AI adds three functions: real-time anomaly flagging, multi-touch attribution and pipeline-level forecasting (Optifai 2025: ±8-15 percent variance with AI vs ±25-35 percent on traditional), and signal extraction from unstructured marketing data (call recordings, chat transcripts, form notes).
- Six modules of a 2026 marketing dashboard: multi-source channel attribution, MQL→SQL→closed-won funnel by source, call source attribution, creative performance with AI insights, blended cost-per-qualified-account, forecast and anomaly alerts.
- Build-versus-buy: Looker Studio is enough for most teams under one data freshness threshold. A warehouse plus BI layer (BigQuery + Metabase as a thin middle path) earns its keep when sources exceed five, freshness matters in under an hour, or the AI layer needs warehouse-level access.
An AI-powered marketing dashboard in 2026 is a unified analytics layer sitting on top of the existing marketing tech stack (Google Ads, GA4, Google Search Console, GTM, HubSpot or another marketing automation platform, Meta Ads, LinkedIn Ads, and a call tracking tool such as CallRail or CallTrackingMetrics). The dashboard does three things single-platform reports cannot: it stitches data sources into end-to-end attribution, it flags channel anomalies and conversion drops in real time, and it forecasts the next 30 to 90 days of MQL and pipeline against spend. The six recommended modules are multi-source channel attribution, MQL-to-SQL-to-closed-won funnel by source, inbound call source attribution, creative and copy performance with AI-extracted insights, blended cost-per-qualified-account, and forecast plus anomaly alerts. The integration problem (identity stitching, UTM discipline, and lead-definition alignment) is the gating prerequisite; per Marketing Sherpa data published on HubSpot's Database Decay Simulation, B2B contact data decays at 2.1 percent per month, and per Forecastio benchmarking, improving CRM data hygiene can lift forecast accuracy by up to 30 percent. Per the Optifai 2025 benchmark of 939 companies, AI/ML-assisted forecasting lands at a ±8 to 15 percent variance band versus ±25 to 35 percent on traditional methods. Build-versus-buy follows source count, freshness requirements, and whether the AI layer needs warehouse-level data; Looker Studio is the practical default for teams under 5 sources, while a thin BigQuery plus Metabase layer is the upgrade for teams that need cross-source joins.
If you run B2B marketing and your team is still reconciling channel reporting on Monday mornings, book a 45-minute strategy call at synapseedge.com/strategy-call. The call walks through your current stack, where the integration gaps are biting hardest, and which two or three modules above would change the most in your next 90 days.
Sources
- Optifai 2025 forecasting benchmark (N=939 companies, Q1-Q3 2025): AI/ML-assisted forecasting variance ±8-15 percent vs rep roll-up ±25-35 percent and weighted-pipeline ±18-25 percent; 15-25 percent accuracy improvement contingent on input data quality.
- Forecastio benchmarking: improving CRM data hygiene can increase forecast accuracy by up to 30 percent, often more than any single change to the forecasting model itself.
- Marketing Sherpa B2B data decay research (published on HubSpot's Database Decay Simulation): contact-record decay at 2.1 percent per month, ~22.5 percent annually on unmaintained databases.
- Multi-touch attribution method overviews (Markov chain, Shapley value, time-decay) summarized across Sales Assembly, "AI Sales Enablement in 2026: A Revenue Leader's Guide" and Varicent, "AI Sales Forecasting Strategy Guide for 2026."
- Call tracking and attribution: CallRail and CallTrackingMetrics platform documentation on dynamic number insertion and CRM integrations; Invoca 2026 Inbound Call Marketing Benchmark Report for industry attribution patterns.